Inside the platform: what RegimeSignal actually publishes

Four layers, each with its own evidence: the market call, the validated signals, the base-rate research, and the per-security evidence board. The captures below are dated photographs of the live platform.

Inside the platform

The market's condition, measured — and stated in advance.

RegimeSignal publishes a current read on the S&P 500 market cycle, forward probability ranges measured against decades of market history, and independent evidence on any US-listed stock. Every figure names its basis and the date it was measured on.

Walk-forward validated out of sample · Computed on our own servers from our own daily bars · Every figure dated and sourced · A publisher of research, not an adviser

RegimeSignal is a market-regime detection and forecasting platform for the S&P 500 and the wider US market. It publishes a current read on the market cycle, forward probability ranges, conditional base rates drawn from decades of history, and per-security evidence screens — all computed on our own models from public market data, refreshed continuously, and every figure carrying the date and basis it was measured on.

It is a publisher of research. It is not an investment adviser, it does not manage money, and nothing it publishes is a recommendation to buy or sell any security.

Layer 1The market call

Where the market sits, stated in advance.

The headline read for the S&P 500: where the market sits in its cycle, whether conditions are strengthening or weakening, and a year-end range with the probability attached to it — never a single number pretending to be a forecast.

Alongside it, two things most commentary never gives you: what the model is watching, and what would change the call.

Layer 2The validated signals

Four signals, held apart from everything else.

Four models carry measured out-of-sample precision and are named wherever they appear: the Bear Regime Signal (BRS), two drawdown classifiers (MBS T1 and MBS T2), and the Recovery Signal (RRS). They are walk-forward validated — trained only on data available at the time of each call, never on the answer — and they are the only work on the platform covered by the independent validation and audit engagements.

They are held apart from everything else on the platform, deliberately. The line between a validated signal and a research finding is the one distinction the whole product rests on, and blurring it would cost more than it could ever sell.

Layer 3Research and base rates

What has actually followed a setup like this one.

What has actually followed a given setup — how often, against what baseline, and whether the sample is large enough to mean anything. Calendar and election-cycle effects tested rather than asserted. Index, sector, global, commodity and thematic readings, each measured against its own threshold.

These are not forecasts, and the platform says so on every one of them. They are the base rate you would be arguing against if you took the other side — which is the thing almost no market commentary gives you at all.

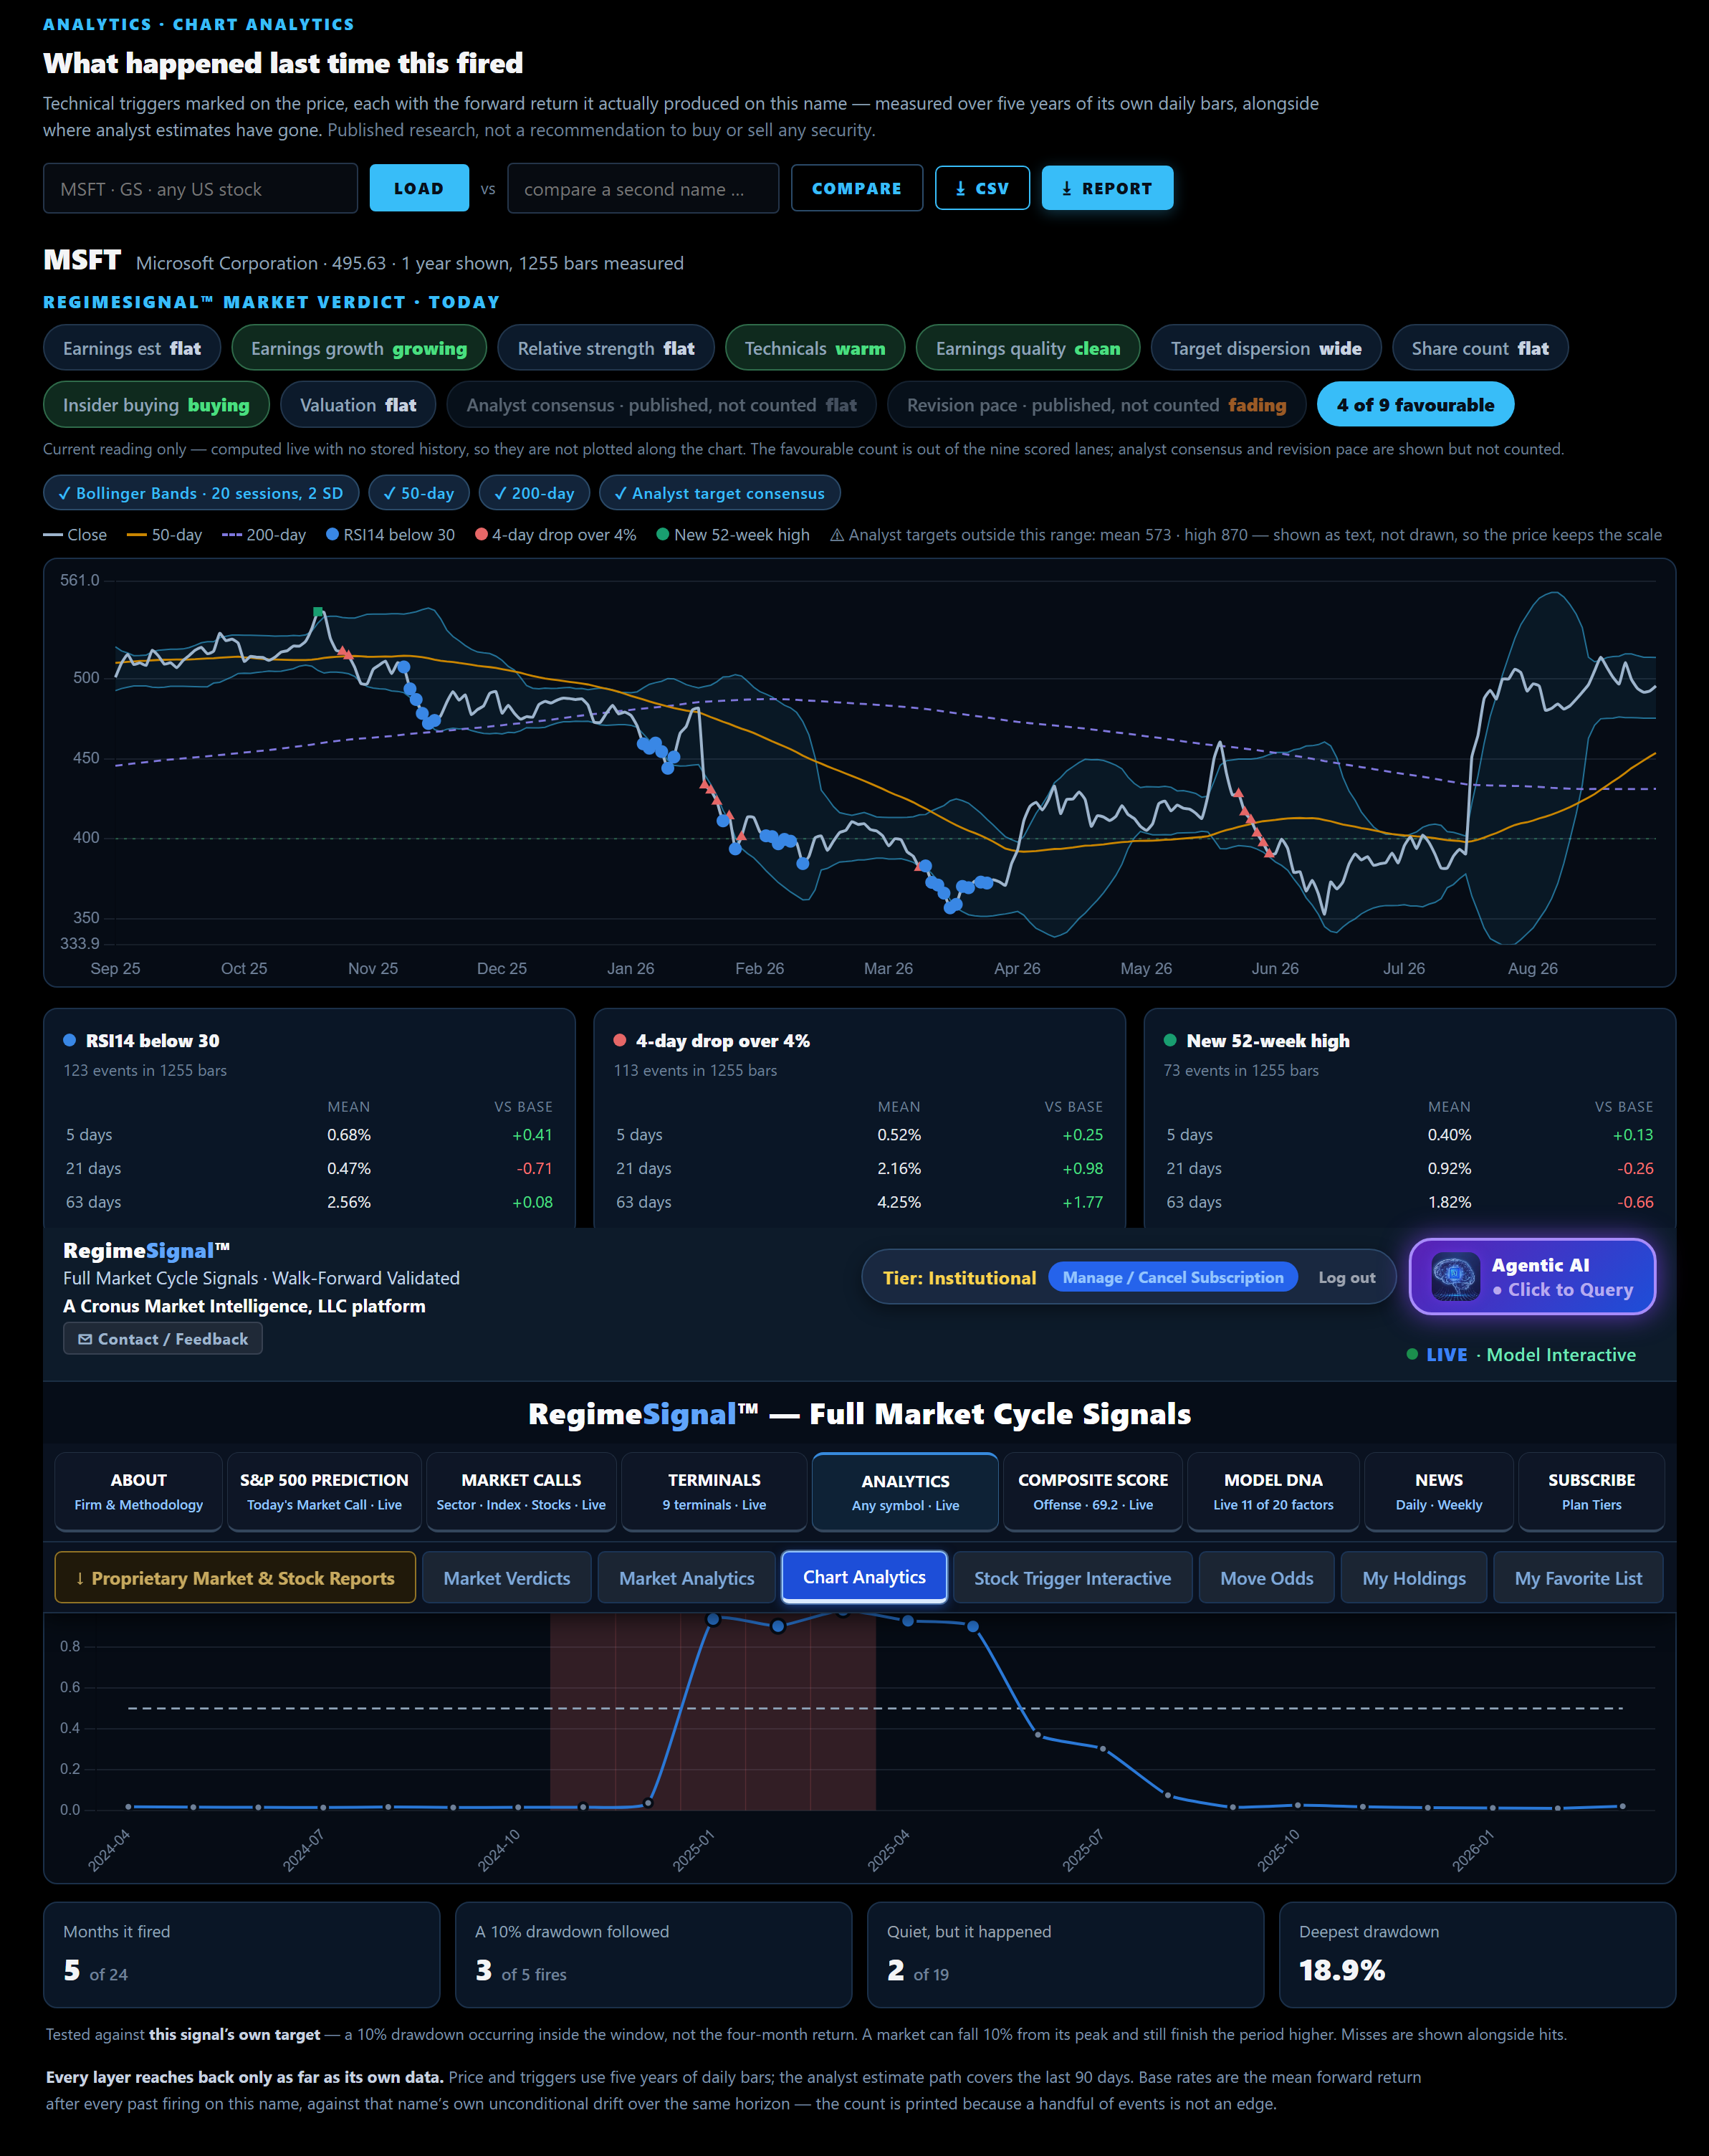
Chart Analytics — a single stock's price with every past technical trigger marked on it and the forward result of each shown against the name's own baseline drift.

Each trigger marked on the price, with what actually followed on this name — and the baseline it has to beat.

Captured September 13, 2026.

Published research, not a recommendation to buy or sell any security. No trigger shown predicts anything.

Layer 4Per-security evidence

Every measure stated separately, never blended.

Every name in the screened universe is read through independent measures — earnings estimates, earnings growth, relative strength, technicals, accounting quality, analyst dispersion, share issuance, insider activity, valuation.

They are never averaged into a single score. That is a deliberate choice: averaging hides the disagreement, and the disagreement is the information. A name where every measure agrees is a different proposition from one where half of them are pulling against each other, and a single blended number makes those two look identical.

  • How much of the evidence agreesoffense, neutral or defense, with the count printed beside it so you can see what it rests on.
  • Whether it is improving or weakeningwhich measure changed, and when.
  • Whether that change was its own, or the whole market's.

That third reading is the one nothing else gives you. A measure that turned on a name the same day it turned across much of the board is market weather. The same measure turning on that name alone is news about that company. They look identical on a screener. They are not the same event, and the platform tells you which one you are looking at.

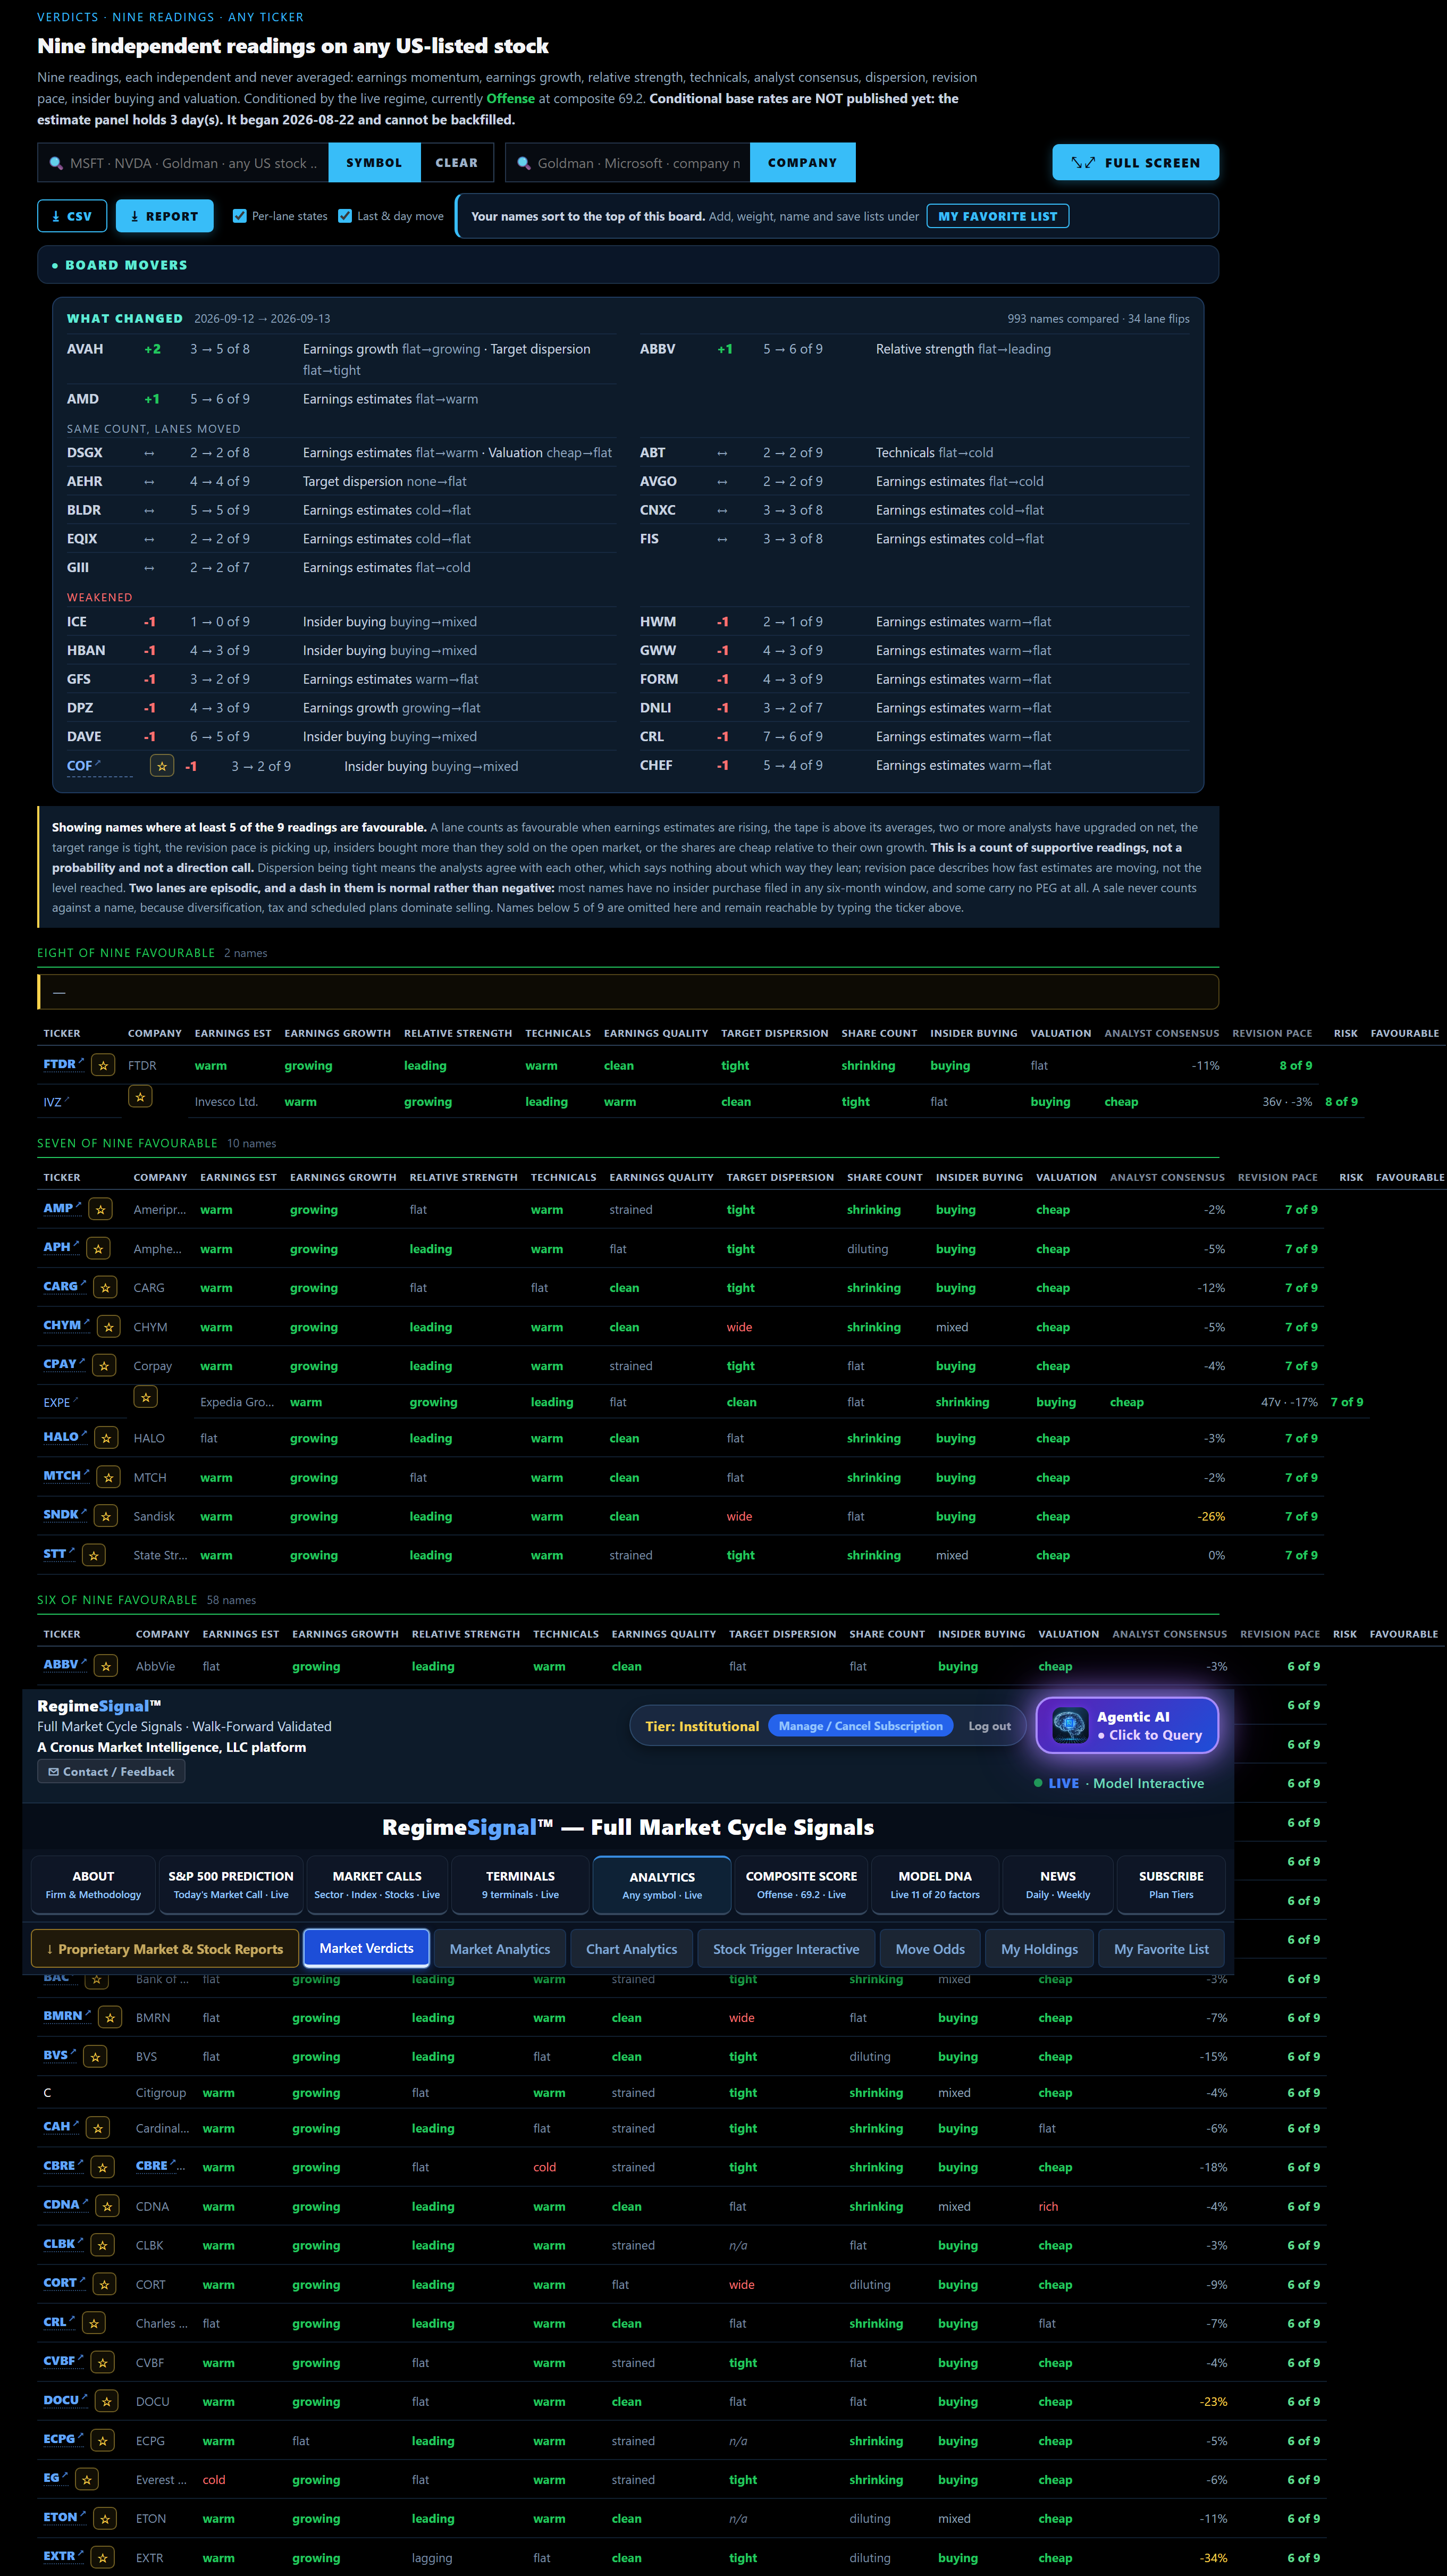
Market Verdicts — the per-security evidence board, with every measure stated separately per name and a day-over-day strip naming which measure moved on which name.

Every name, every measure, stated separately — and what changed since yesterday.

Captured September 13, 2026.

An evidence board, not a buy list. No recommendation to buy or sell any security.

Also liveCoverage

Beyond the S&P 500.

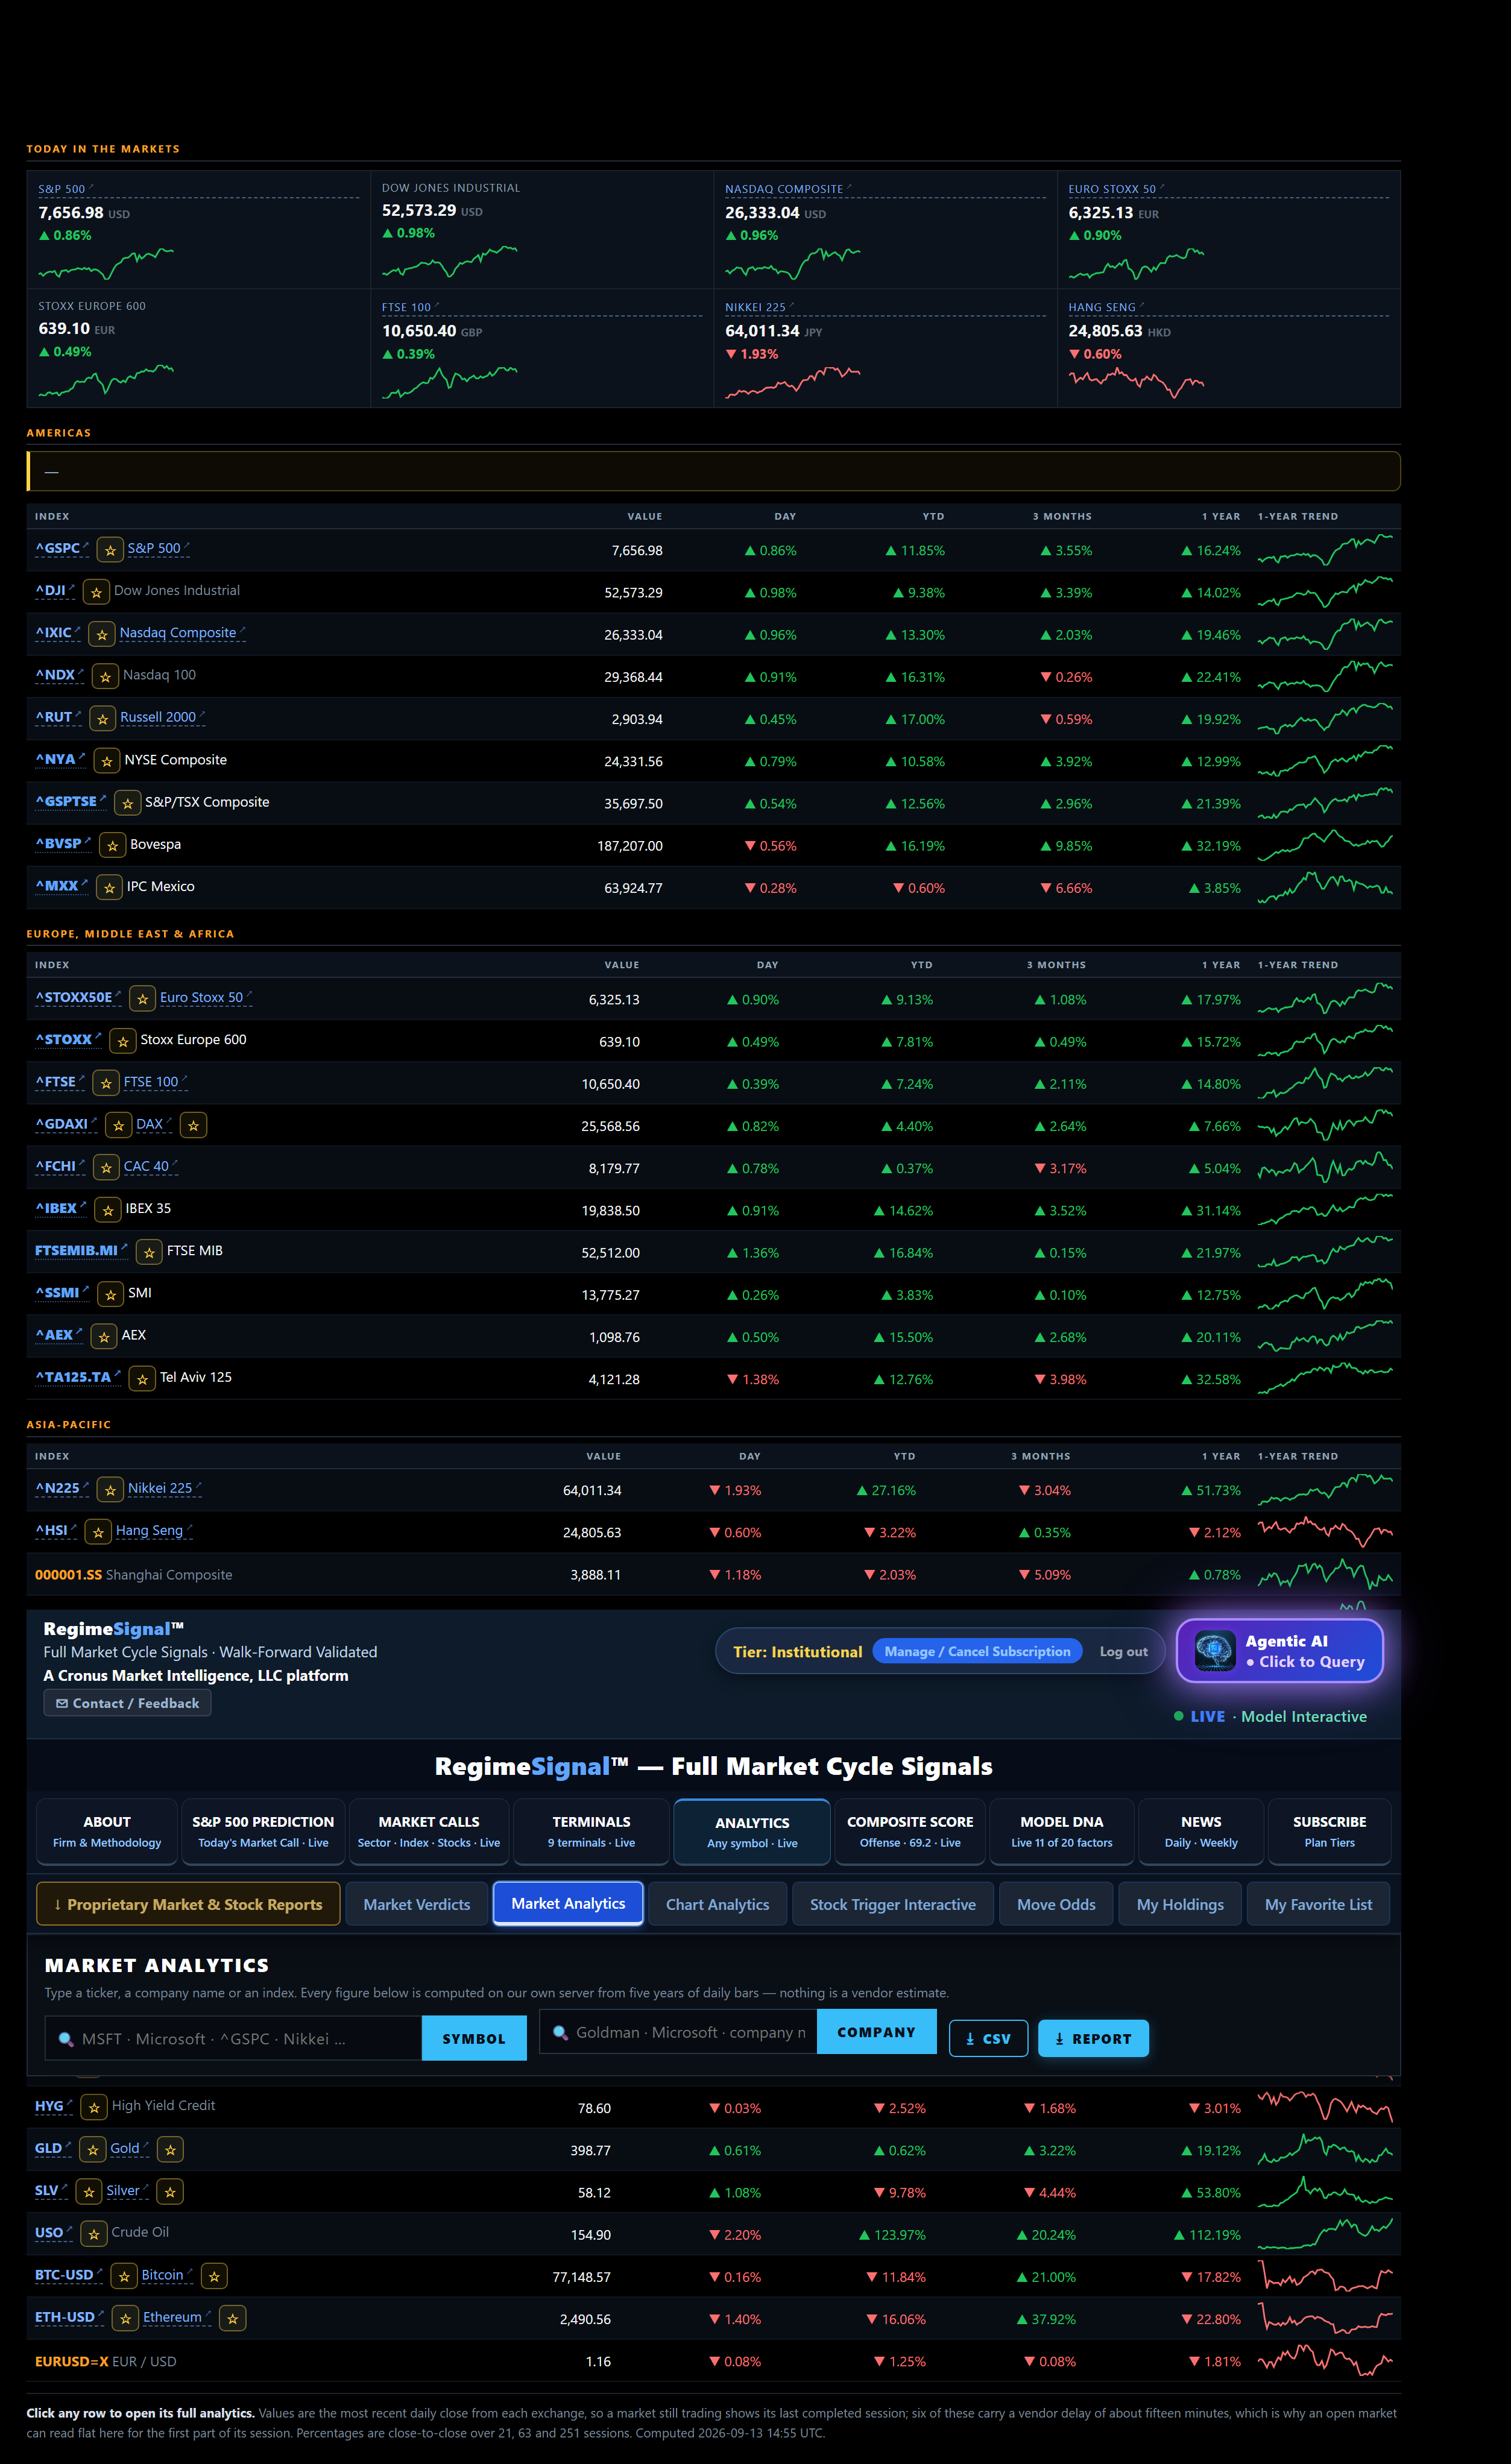
Index coverage across the Americas, Europe/Middle East/Africa and Asia-Pacific, plus credit, metals, energy, crypto and FX — each with day, year-to-date, three-month and one-year change and a one-year trend line.

Market Analytics — global index coverage across the Americas, EMEA and Asia-Pacific, plus credit, metals, energy, crypto and FX, each with change columns and a one-year trend line.

Coverage beyond the S&P 500, with the as-of time and the vendor delay stated on the page.

Captured September 13, 2026.

Values are the most recent completed session. Some rows carry a vendor delay of about fifteen minutes. Not real-time quotes.

Move OddsMagnitude without direction

How violently, not which way.

This is the one call on the platform that does not name a direction. It says how big, never which way.

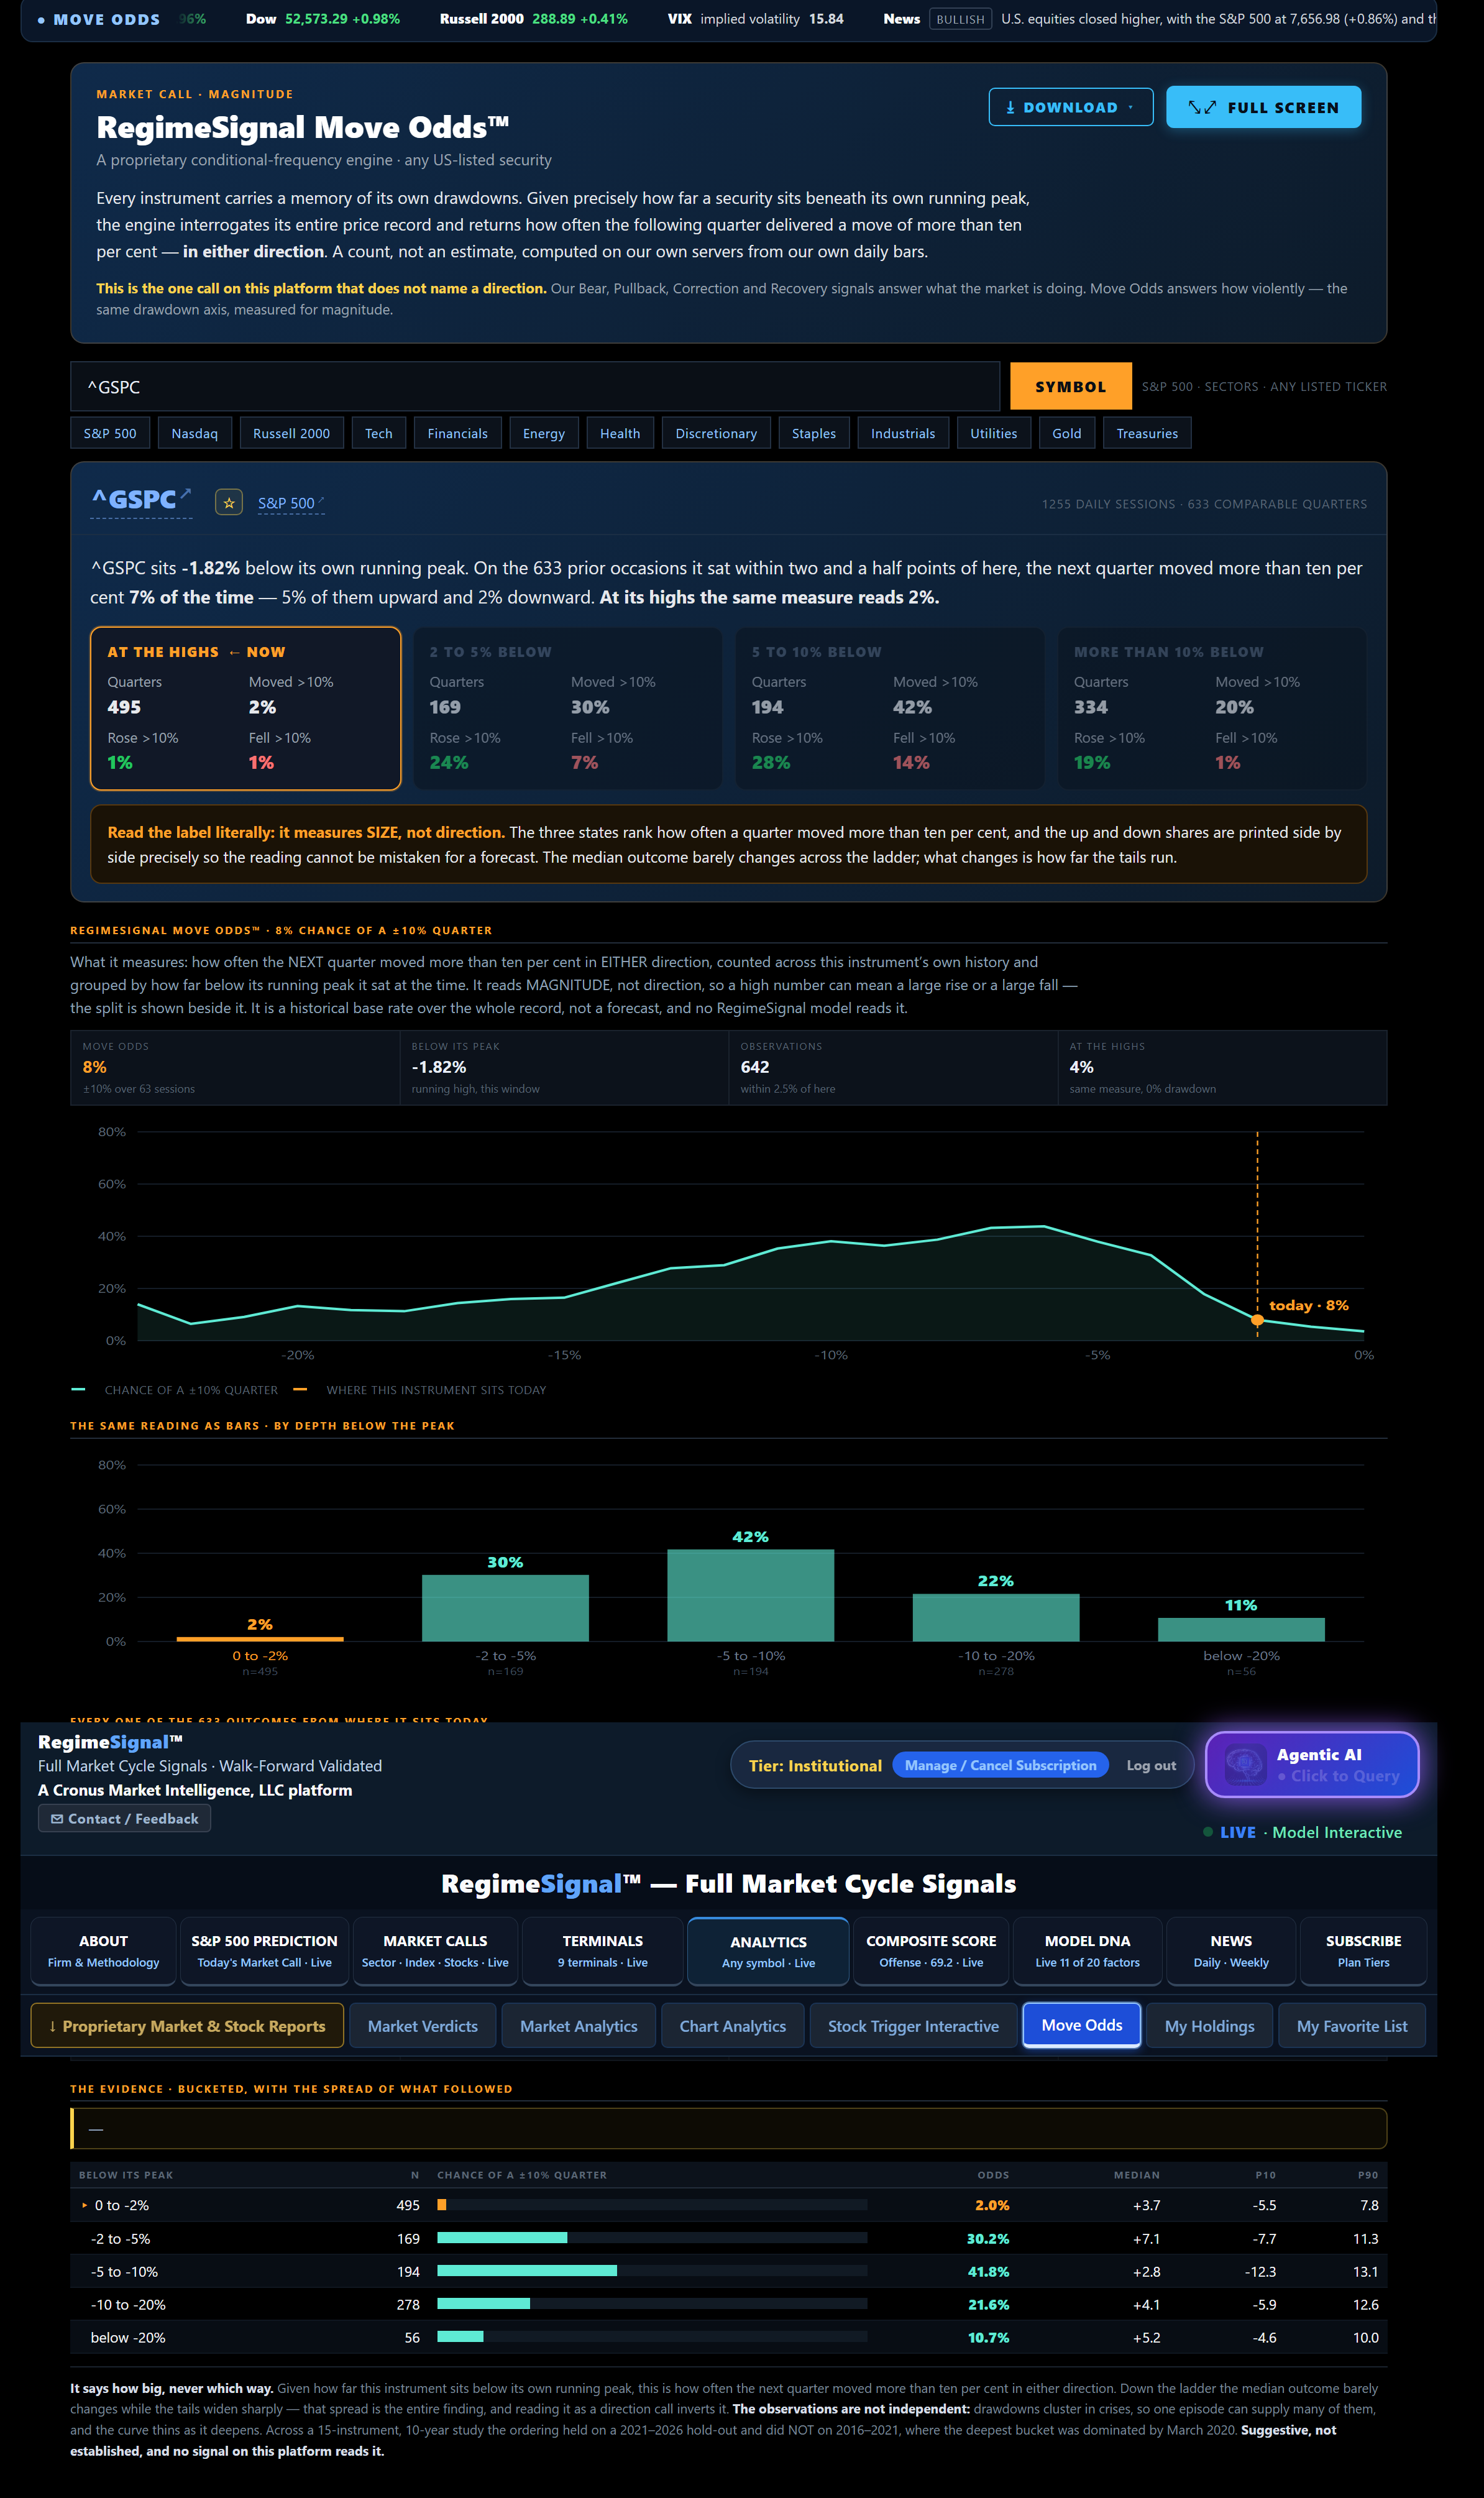
It measures how often the following quarter delivered a move of more than ten percent in either direction, grouped by how far the instrument sat below its own running peak, counted across its entire price record.

The platform states plainly that the finding is suggestive rather than established, that the observations are not independent because drawdowns cluster in crises, and that no signal on the platform reads it.

Move Odds — how often the following quarter delivered a move of more than ten percent in either direction, grouped by depth below the instrument's own running peak.

How violently, not which way. A count across the instrument's own history, not an estimate.

Captured September 13, 2026.

No direction, forecast or probability of a rise or fall is implied, and no RegimeSignal model reads it.

Also live on the platform

  • Movement over time, not just today. The platform records when each measure changed on each name, which measure changed it, and how much of the whole board moved the same day. Price is charted with every one of those changes marked on it.
  • Sector context per name. A company's sector earnings growth and margin against the index, plus that sector's own drawdown model.
  • Downloadable written reports on every analytic page. Not a table dump: a document that explains what the figures mean, what would change them, and what they do not claim. Charts included.
  • Earnings season tracking. Measured against FactSet, with each figure naming its basis and its as-of date.
  • A live news feed. Filtered to market-relevant items, deduplicated across wire revisions of the same story.

Captures are dated photographs of the live platform taken September 13, 2026. Figures visible inside a capture are as of that date and are not claims about current coverage. RegimeSignal is a publisher of market research operated by Cronus Market Intelligence, LLC. It is not a registered investment adviser and does not provide personalized investment advice. Published research is informational only and is not a recommendation to buy or sell any security. Model results are historical and past results do not indicate future results.

Sample reports

Two documents RegimeSignal publishes, exactly as subscribers receive them. Every figure is dated, sourced and rule-stated; nothing has been edited for presentation.

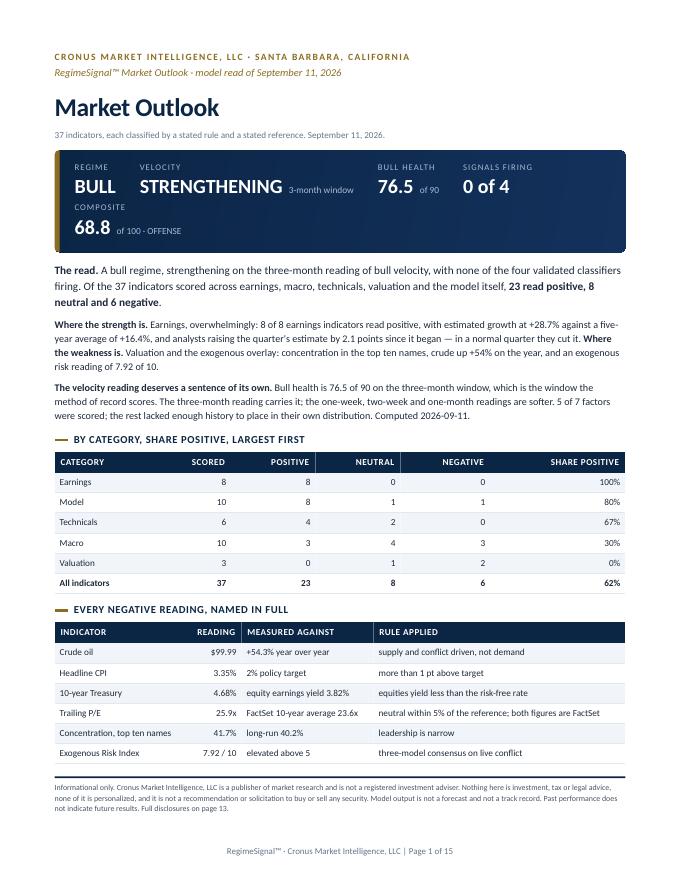
First page of the Market Outlook sample report

Market Outlook

Model read of September 11, 2026 · 15 pages

The S&P 500 read in full: 37 indicators, each classified by a stated rule against a stated reference, with every negative reading named rather than summarized away.

  • Regime, bull velocity and the composite score
  • Earnings, macro, technicals and valuation, scored by category
  • The four validated signals with their current readings
  • Cycle position, the confidence readings and the scorecard in full
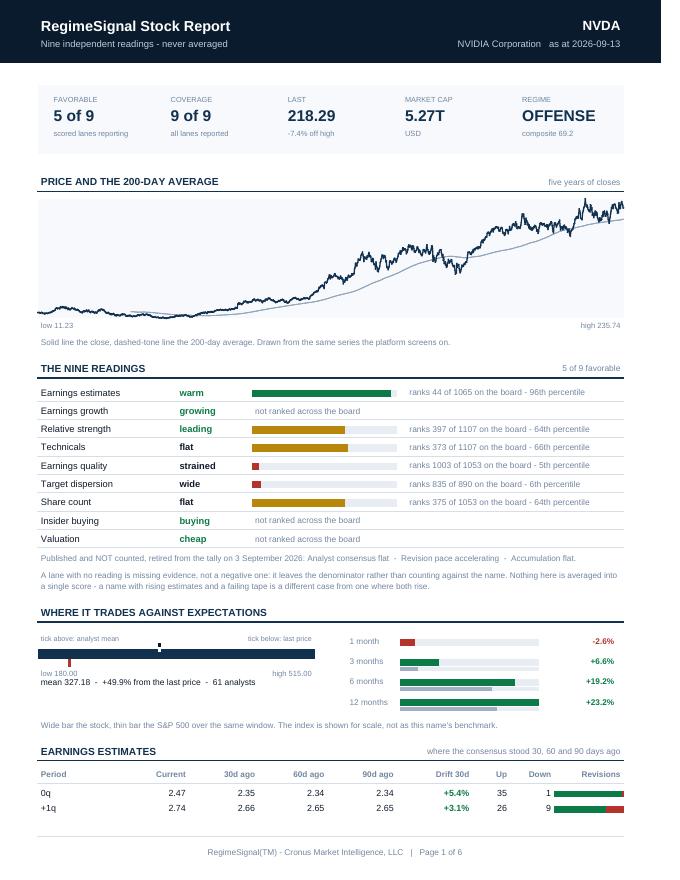
First page of the Stock Report — NVDA sample report

Stock Report — NVDA

NVIDIA Corporation as at September 13, 2026 · 6 pages

Nine independent readings on a single name, never averaged into one score. A lane with no reading leaves the denominator rather than counting against the name.

  • The nine lanes, each ranked against the screened board
  • Estimate drift, revisions and reported against expected
  • Accumulation, insider activity and the 52-week range
  • The market state the name sits inside, and what the report does not claim

Informational only. Cronus Market Intelligence, LLC is a publisher of market research and is not a registered investment adviser. Nothing in these documents is investment, tax or legal advice, none of it is personalized, and it is not a recommendation or solicitation to buy or sell any security. Model output is not a forecast and not a track record. Past market signal record does not guarantee future results. The readings in these samples are as of the dates shown and are not current.

Compare plan access on pricing or browse the terminals.

Early warning, before consensus.

The RegimeSignal framework — four walk-forward validated prediction signals and Bull / Bear Velocity gauges for the S&P 500. Take a free 15-minute look inside the live model, or start your 7-day free trial today.